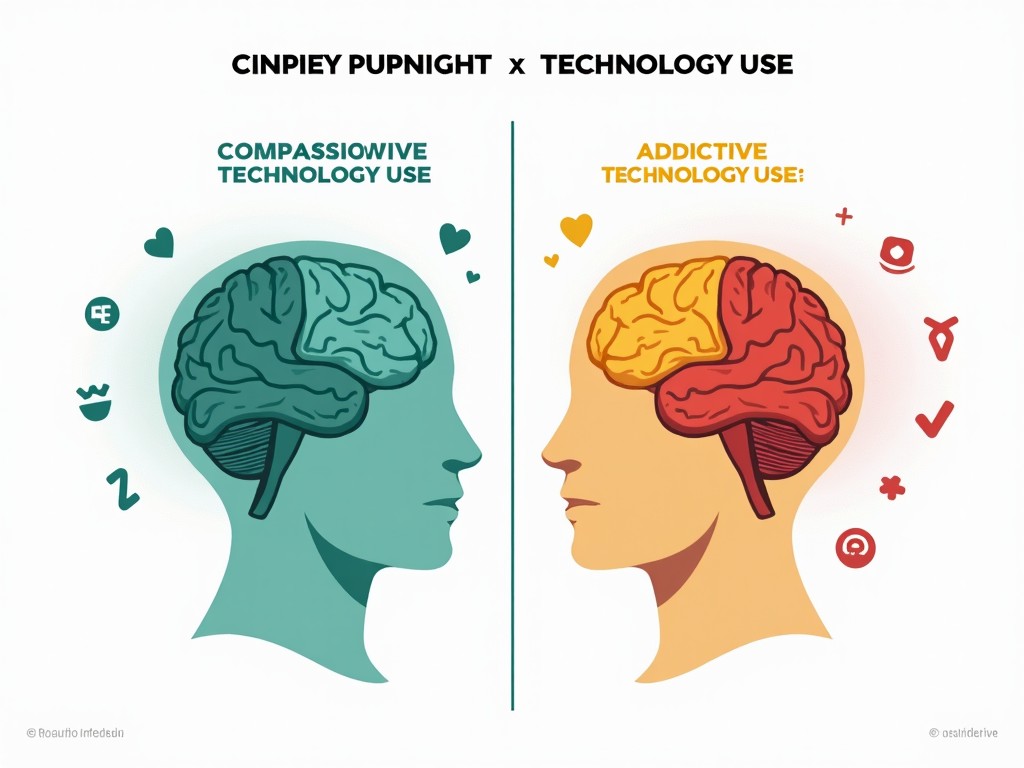
Brain Activity During Compassionate vs. Addictive Technology Use

c
Generated by FLUX.1-pro
G
Image Size: 1024 x 768
Flux AI Model: FLUX.1-pro
Generator: Landscape 4:3
Flux Prompt
AI Prompt
More Flux Images About Comparison of brain activity during different types of technology use
Brain Activity During Compassionate vs. Addictive Technology Use and Related Flux Artwork
gloom and vibrancy
technology ethics
corporate skyline
Split-screen art
Diverse hands
blockchain network
community values
stylized illustration
colorful illustration
vibrant illustration
community engagement
economic disparity
urban skyline
surveillance society
contrasting scenes
Corporate greed
Financial Symbols
hands reaching up
Blockchain Technology


