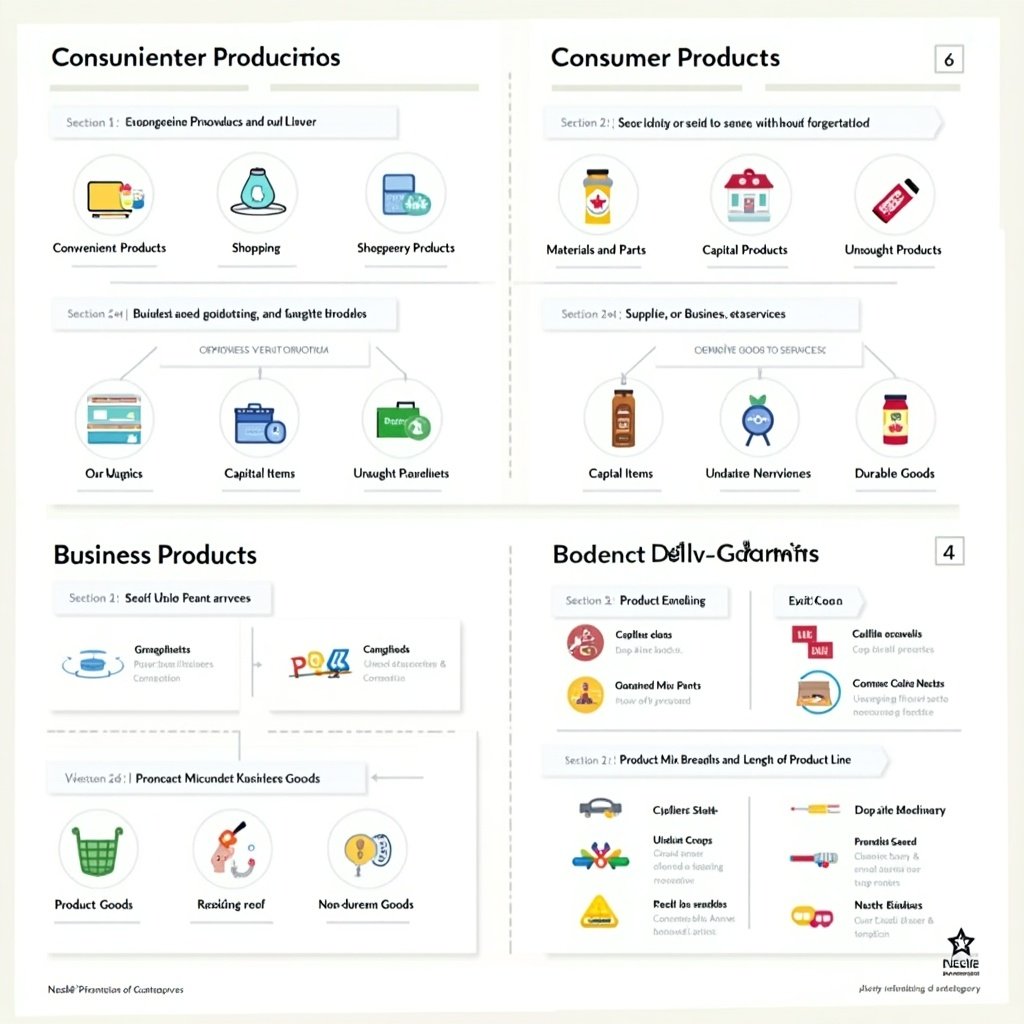
Q1. Types of Consumer Products
a. Convenience Products
• Products bought frequently, with minimal effort, and low involvement.
Examples:
• Staples: Everyday items like milk, bread, rice.
• Impulse: Products bought without prior planning, e.g., chocolates, chewing gum.
• Emergency: Products needed urgently, e.g., umbrellas during rain, batteries during power outages.
b. Shopping Products
• Products consumers compare based on quality, price, and style.
Examples:
• Homogeneous: Similar products where price comparison is crucial, e.g., TVs, washing machines.
• Heterogeneous: Unique products differing in features, e.g., furniture, clothing.
c. Specialty Products
• Products with unique characteristics or brand loyalty.
Examples: Luxury cars (Tesla), designer bags (Gucci).
d. Unsought Products
• Products not actively sought until needed.
Examples: Life insurance, funeral services.
Q2. Types of Business Products
a. Materials and Parts
• Used in the production process.
i. Raw Materials:
• Farm Products: Natural items from farms, e.g., wheat, cotton.
• Natural Products: Extracted resources, e.g., crude oil, timber.
ii. Manufactured Products:
• Materials: Fabricated inputs, e.g., steel, plastics.
• Components: Finished parts used in products, e.g., car engines.
b. Capital Items
• Products used in production for long periods.
Examples:
• Installations: Large investments like factories, heavy machinery.
• Equipment: Tools like computers, forklifts.
c. Supplies or Business Services
• Support operations without becoming part of the end product.
i. Maintenance Supplies:
• Cleaning materials, lubricants.
ii. Business Services:
• Maintenance services (repair), advisory services (legal, IT consulting).
Q3. Types of Products Based on Longevity
a. Durable Goods
• Long-lasting products requiring infrequent purchases.
Examples: Furniture, cars, home appliances.
b. Non-durable Goods
• Products consumed quickly, requiring regular replenishment.
Examples: Food, cosmetics, disposable items.
c. Services
• Intangible offerings consumed as delivered.
Examples: Haircuts, education, transportation.
Q4. Product Mix Terms
a. Product Mix Breadth
• Number of product lines offered by a company.
Example: Nestlé’s food, beverages, and pet care lines.
b. Length of Product Line
• Total number of products in a specific line.
Example: Nestlé’s dairy line includes Milkmaid, Nestlé Everyday, and Nestlé A+ Milk.
c. Depth/Item Design of Product Mix
• Variations of products within a line.
Example: Nestlé’s KitKat comes in flavors like milk chocolate, dark chocolate, and orange.
d. Consistency of Product Mix
• Degree of similarity among product lines.
Example: Nestlé’s focus on nutrition across food, beverages, and health products.
Q5. Product Mix of Nestlé
Based on Nestlé’s website:
1. Beverages: Coffee (Nescafé), Tea (Nestea), Health Drinks (Milo).
2. Dairy Products: Milkmaid, Nestlé A+ Milk.
3. Culinary Products: Maggi noodles, sauces.
4. Nutrition and Health Science: Cerelac, Lactogen.
5. Confectionery: KitKat, Munch, Milky Bar.
6. Pet Care: Purina products.
Q6. Criteria for Product Mix Breadth Decisions
i. Risk Diversification:
• Diversify offerings to reduce reliance on a single product line.
Example: Nestlé entering pet care reduces dependence on food and beverages.
ii. Leveraging Organizational Strengths:
• Build on core competencies to expand product lines.
Example: Nestlé leveraging expertise in nutrition to develop health science products like Cerelac.
iii. Complementary-in-Use Products:
• Introduce products used together to enhance customer experience.
Example: Nestlé’s beverages (Nescafé) and snacks (KitKat) target the same consumer moments, Visual representation of different types of consumer and business products. Organized sections outlining convenience, shopping, specialty, and unsought products. Details on materials, parts, capital items, maintenance supplies, and product longevity. Infographics on product mix breadth, length, and consistency featuring Nestlé. Clear icons and simple descriptions

