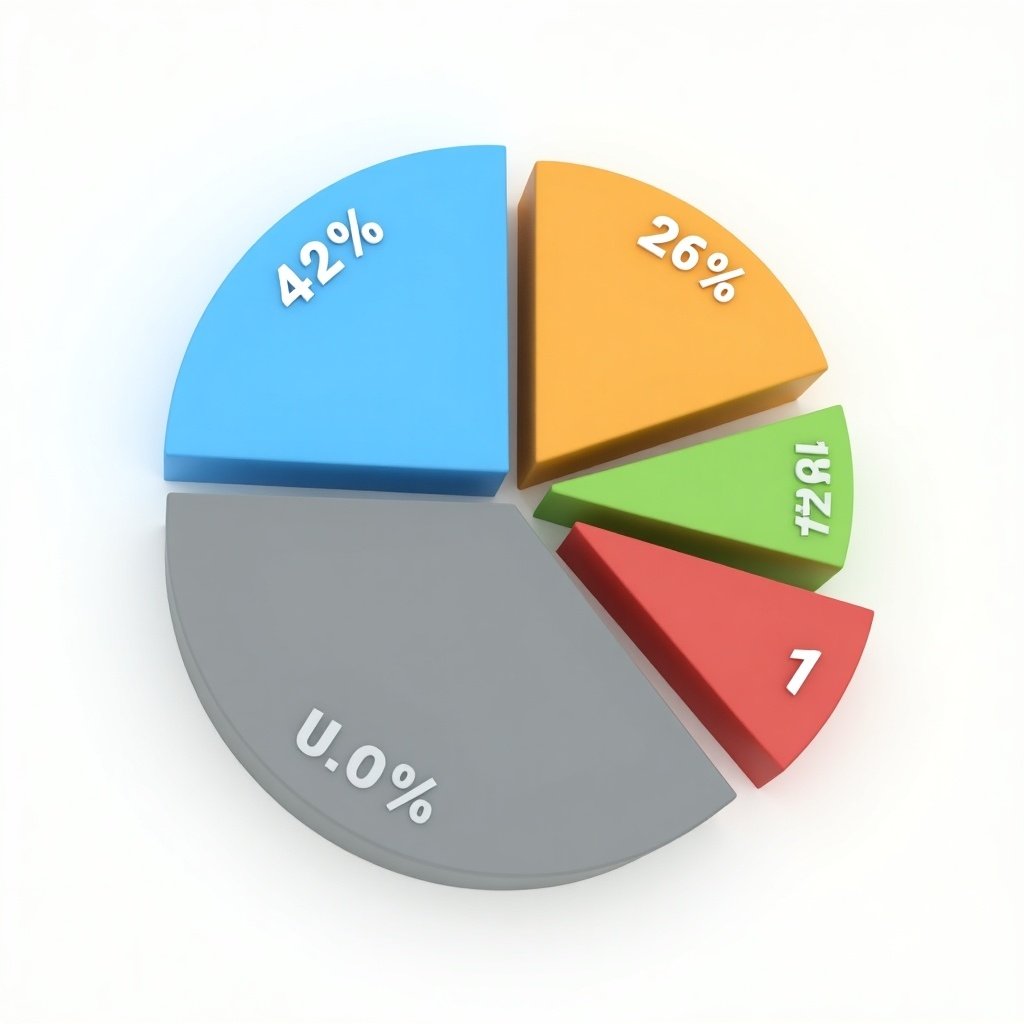
3D pie chart illustration with 5 parts, the 42% part with blue color, the 26% part with orange color, the 21% part with gray color, the 10% part with green color and the 1% part with red color, 3D pie chart illustration with five segments. The 42 percent segment is blue. The 26 percent segment is orange. The 21 percent segment is gray. The 10 percent segment is green. The 1 percent segment is red

