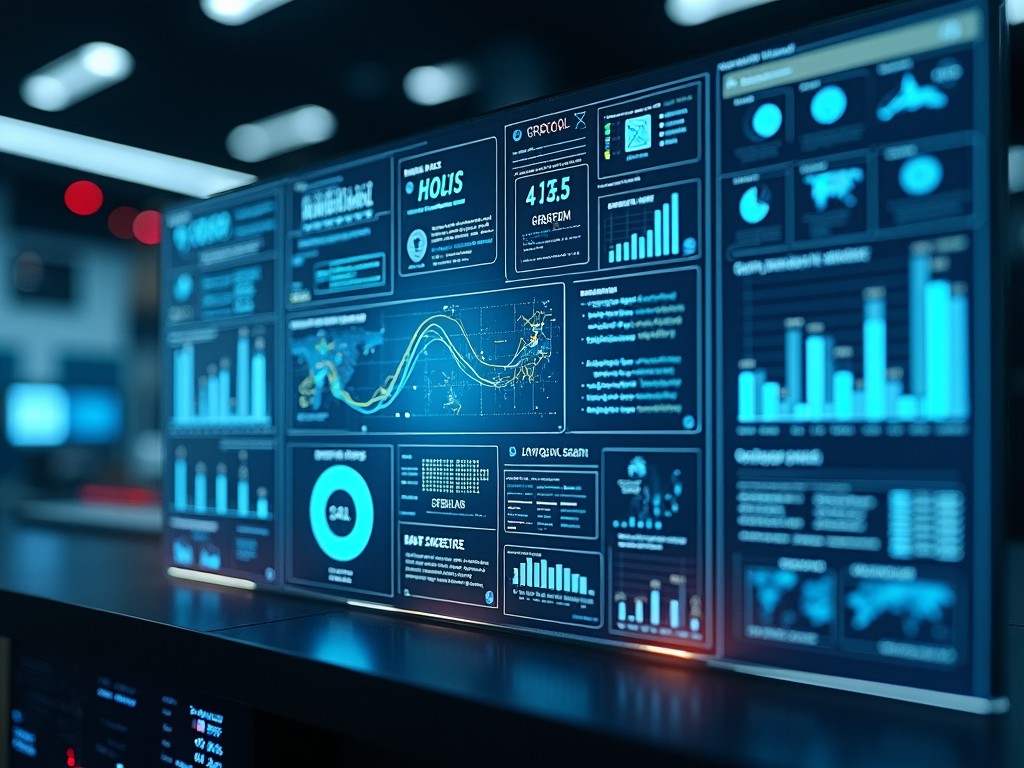
High-Tech Data Visualization Dashboard for Analytics in Business
Flux Prompt

AI Prompt

More Flux Images About A high-tech data analytics dashboard

High-Tech Data Visualization Dashboard for Analytics in Business and Related Flux Artwork

The image depicts a colorful and interactive business analytics dashboard designed for financial analysis. It features various charts and graphs that display key performance indicators and trends. Each section provides insights into different aspects of the business, such as revenue, expenses, and market performance. The layout is clean and user-friendly, making it easy to interpret data at a glance. This dashboard is ideal for professionals seeking to make data-driven decisions.
2 images
p

FLUX.1-pro Image

Colorful Interactive Business Analytics Dashboard for Financial Analysis

A person is using a laptop with various data charts and graphs on the screen while holding a smartphone.
3 images

Flux Image Generator

Analyzing Data at a Glance

A laptop displays various graphs and charts analyzing data in a dimly lit room.
3 images

Flux AI Image

Digital Insights

This image features a collection of digital icons representing data visualization and analytics. The icons include various graphs and charts, indicating growth and performance indicators. Each icon employs a green and blue color palette, which conveys a modern and professional feel. The design is minimalist, ensuring clarity and ease of understanding for viewers. These icons are ideal for use in business presentations or marketing materials related to data analysis and reporting.
M

Flux AI

Modern Business Analytics and Data Visualization Icons Set

A laptop displaying a bar graph is open on a wooden table, with a cozy lamp and blurred background adding a warm ambiance.
3 images

Flux AI Image Generator

Illuminated Analytics

The image showcases a modern mobile application interface focused on data extraction and analytics. There are three separate screens displayed on smartphones, each featuring user-friendly designs. The screens contain various graphs, statistics, and user data representations, emphasizing a clean and accessible layout. The overall color scheme combines blue and white elements, which adds a tech-savvy feel. This design gives an overview of how users can interact with data visually and intuitively.
R

Flux AI

Modern Mobile App Interface for Data Extraction and Visualization