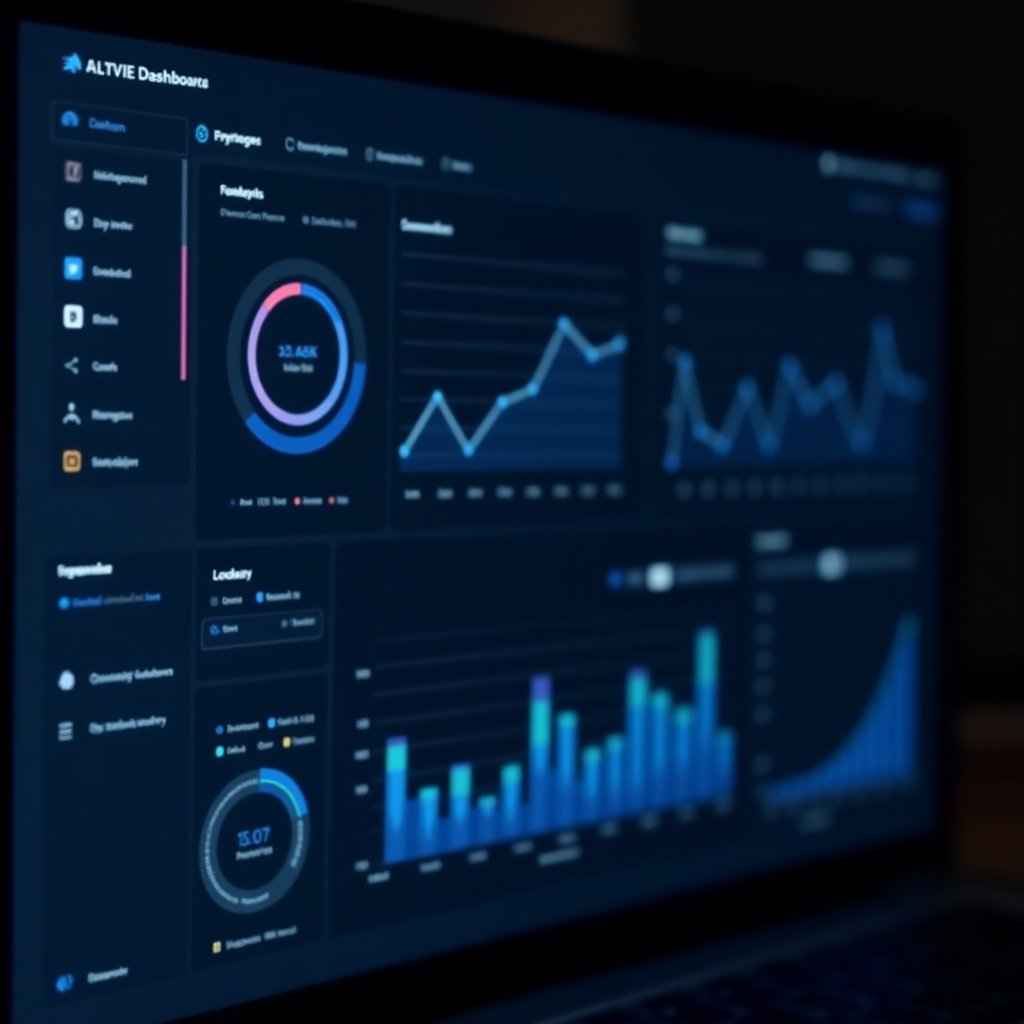
The image shows a modern data analytics dashboard. There are multiple graphs and charts displayed on the screen, all with a high-tech aesthetic. The color scheme is primarily blue, black, and white, providing a cool, professional look. The dashboard is illuminated softly, which emphasizes its graphical content. This visualization represents key metrics and data points, likely used for business intelligence or data analysis tasks, Modern data analytics dashboard with multiple graphs and charts. High-tech aesthetic with a blue, black, and white color scheme. Soft illumination highlights the graphical content. Represents key metrics and data points for business intelligence

