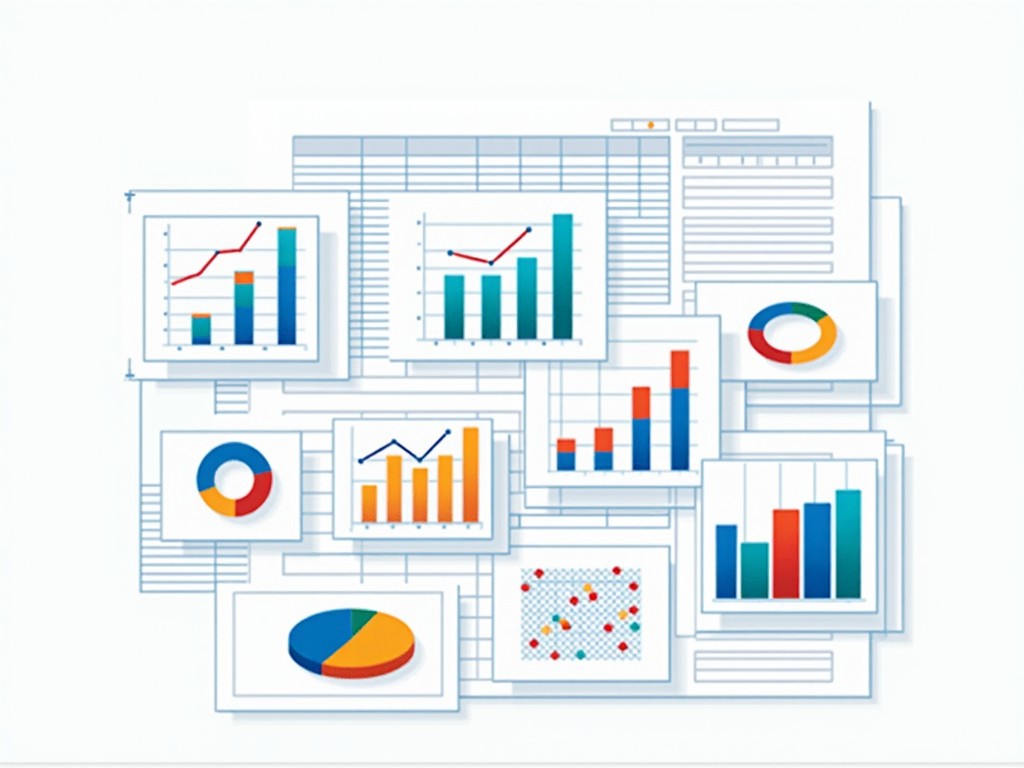
Illustration of Data Visualization Techniques in Excel
I
Generated by FLUX.1-pro
G
Image Size: 1024 x 768
Flux AI Model: FLUX.1-pro
Generator: Landscape 4:3
Flux Prompt
AI Prompt
More Flux Images About Illustration of various data visualizations
Illustration of Data Visualization Techniques in Excel and Related Flux Artwork


V


2 images
p

A


