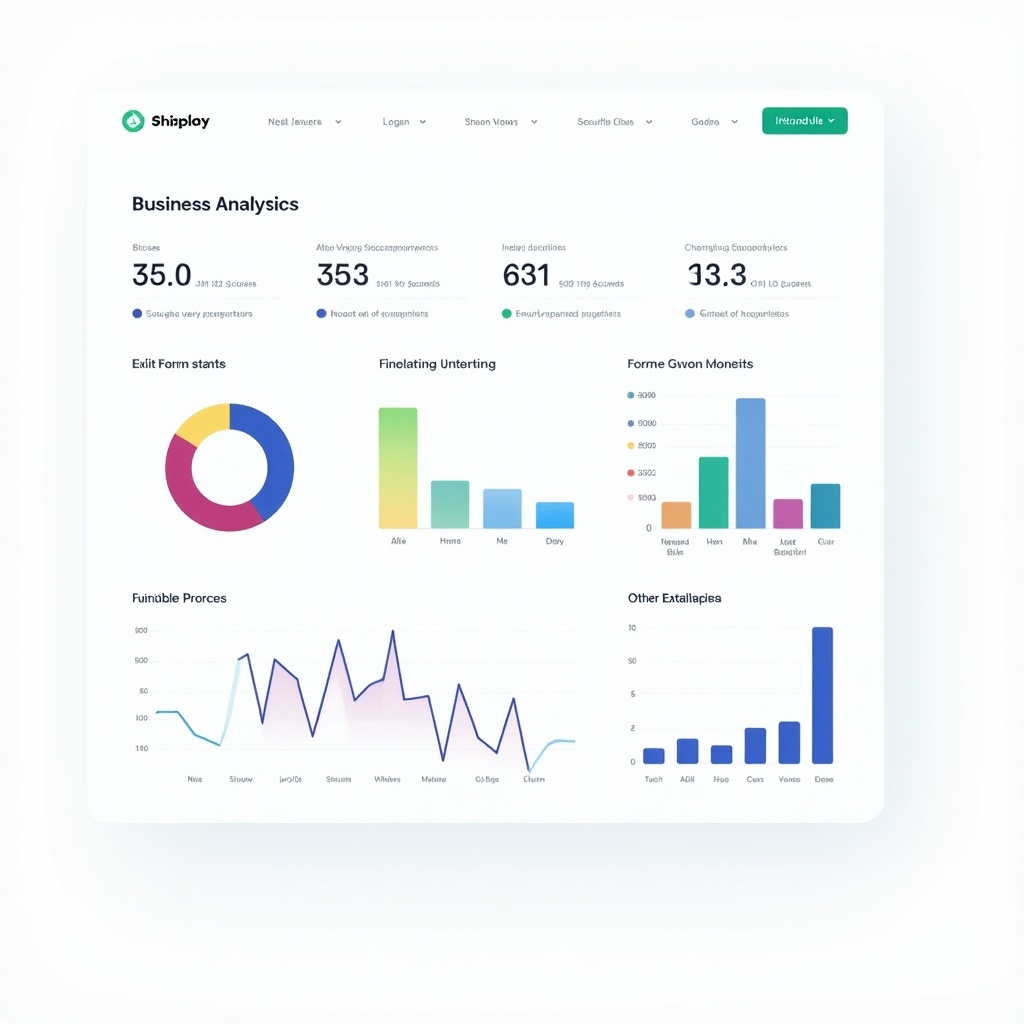
A colorful business analytics displaying various charts and graphs for financial analysis, This image showcases a colorful business analytics dashboard featuring various charts and graphs. It includes metrics such as 'Exit Form starts' and 'Finalizing Untarring' presented visually. The layout is bright and clean, making it easy to interpret the financial data. Each graph represents different data sets, with vibrant colors aiding in differentiation. The overall design reflects modern user interface aesthetics, suitable for business-related applications

